Release highlights:
Analyst’s Notebook 10.1.2
Badges on chart entities and links
- Badges allow the user to add up to 6 fixed position visual indicators to both chart entities and links.
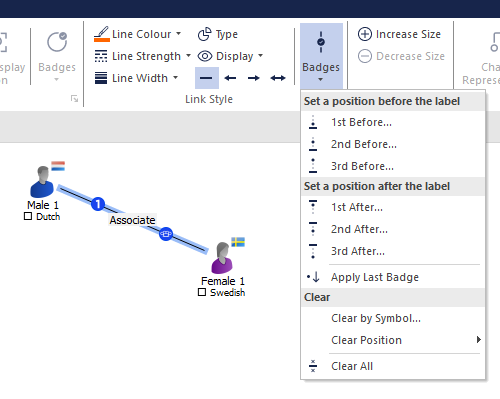
Badges are available for all entity representations, for example icons, them lines and events.
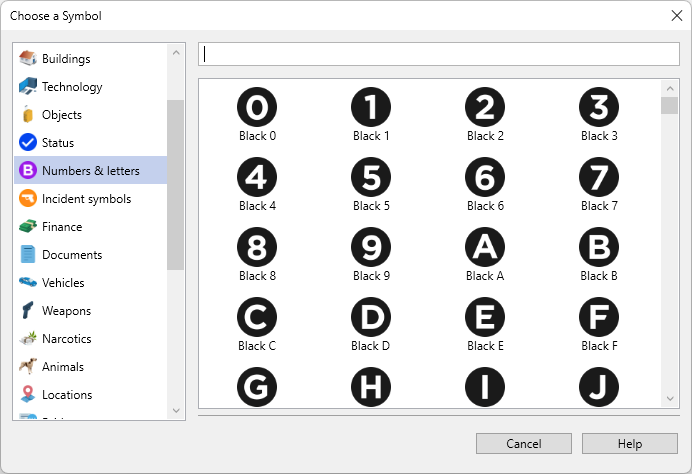
- In addition to the entity icons, additional symbols have been provided tailored for use in badges. These cover categories such as Status, Numbers & Letters and Incident symbols.
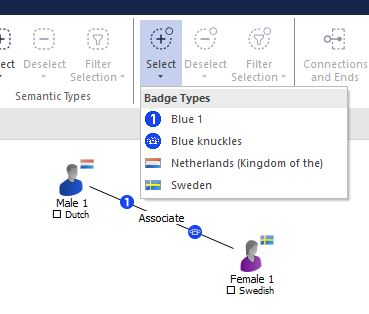
New selection options
- Additional selection options can be found in the Selection ribbon menu that apply to the use of badges on chart items. They allow:
- Selection and deselection of chart items with a specific badge symbol.
- Filter the chart selection by a specific badge symbol.
New analysis attributes
- New analysis attributes to support the new badges feature have been added:
- Per entity and link badge position analysis attributes.
- Aggregated entity and link analysis attribute for all symbols used.
- The new analysis attributes are available in:
- List Items
- Bar Charts and Histograms
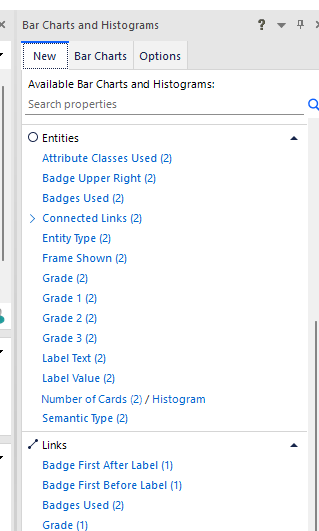
Visual Search and Search
New styles in Conditional Formatting rules
- When creating new Conditional Formatting rules, badges have been added as a new style that can be changed for both entities and links:
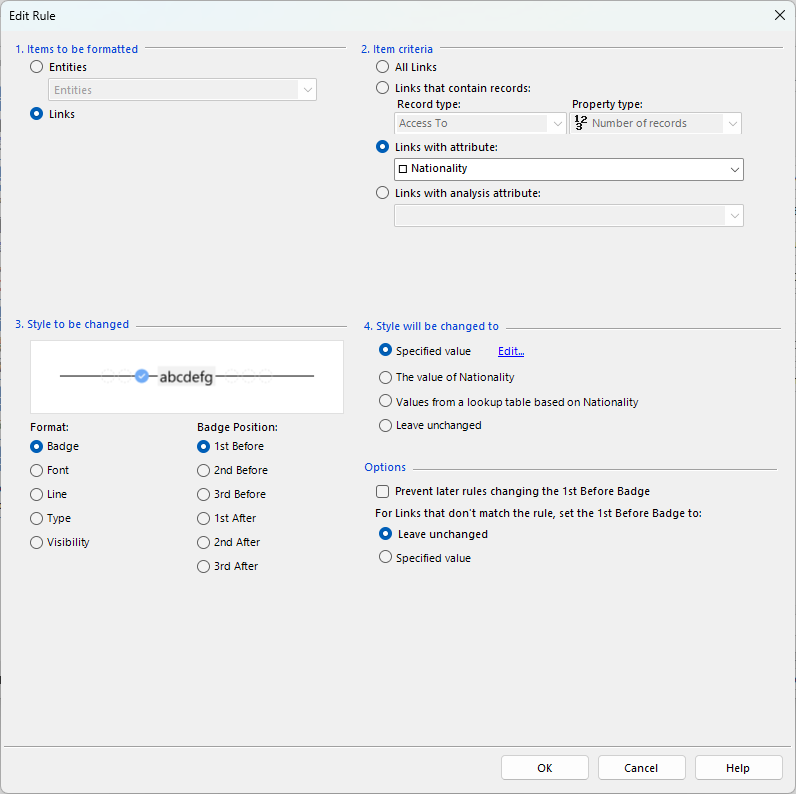
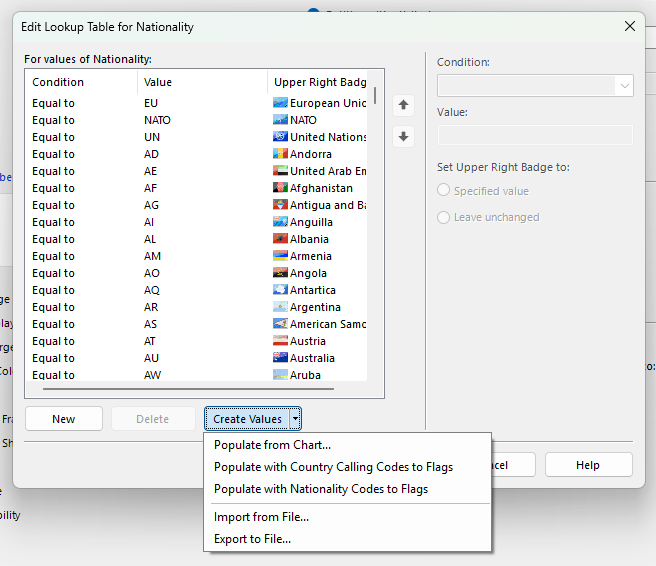
Enhanced lookup tables in Conditional Formatting rules
- The lookup table control used when building Conditional Formatting rules has been enhanced with the following:
- If the style relates to the display of an icon or symbol, the target value column will now visually display the related icon and friendly display name as seen in the icon picker.
- Population of the table has been extended from just values from the current chart to:
- Pre-canned tables we have supplied with the product.
- The ability to export the current table to an external file that can be subsequently imported into another rule.
Release highlight details – Web client 4.4.7
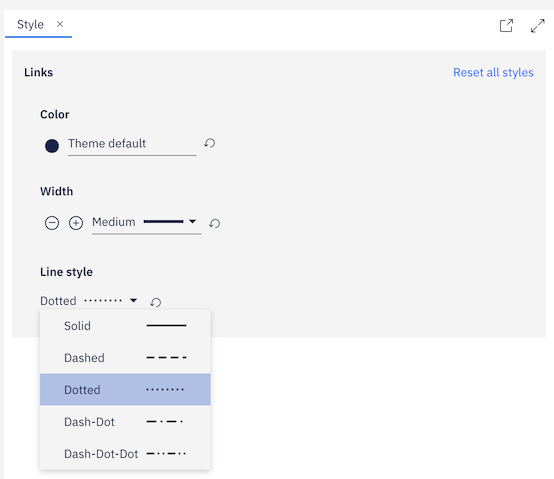
Manual line styling
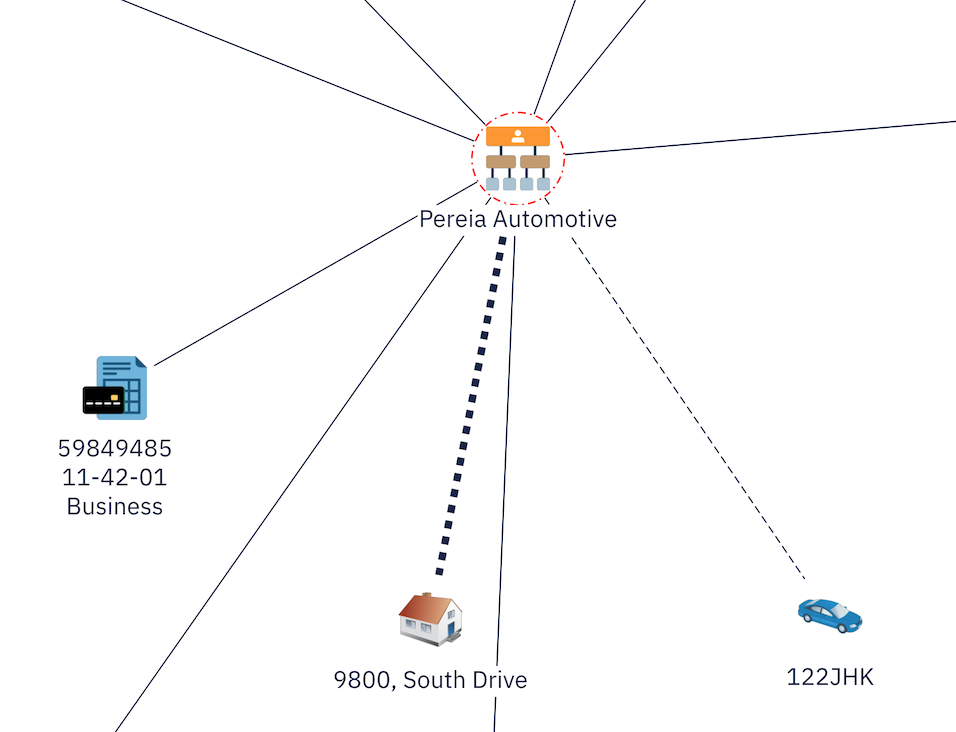
- Users can now apply dotted and dashed line styles to links and to the borders of nodes and groups on the web chart, providing a visual means to represent confidence levels and other qualitative attributes of items and relationships. This brings the web client closer to feature parity with the desktop application.
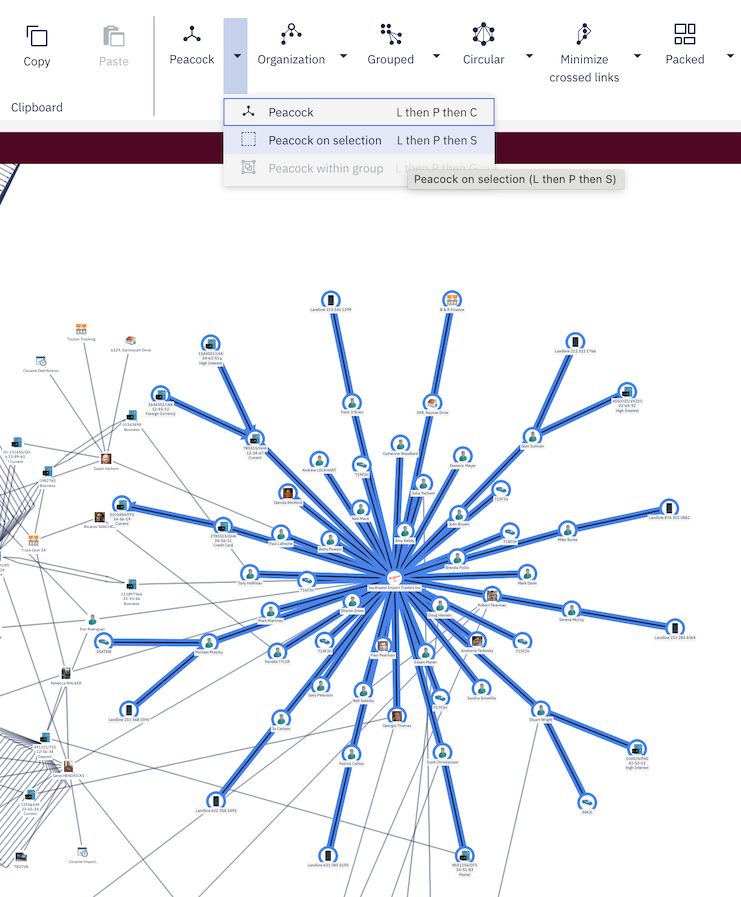
Layout on selection
- Users can now apply a layout to a selected subset of items on the chart without rearranging the entire chart. This allows analysts to maintain custom visual continuity on large, complex charts while still being able to organize specific groups of items, for example by applying a hierarchy layout to one cluster while leaving the surrounding network untouched.
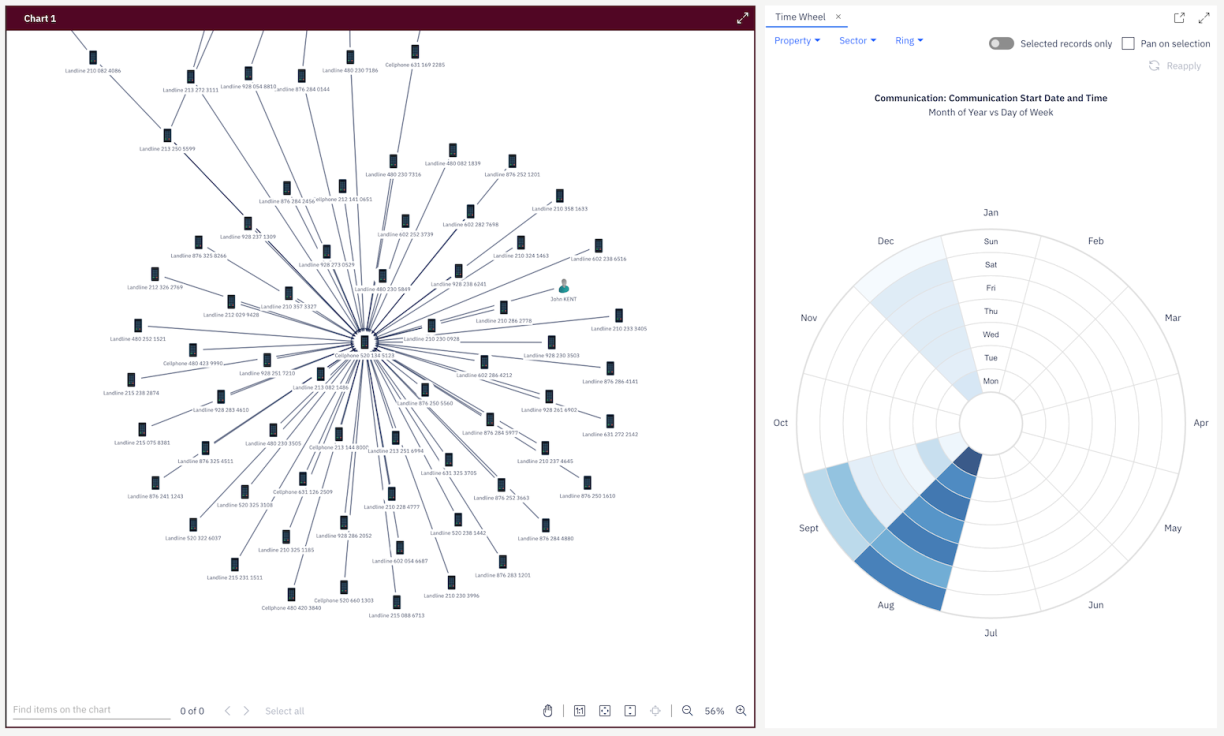
Time Wheel
The Time Wheel from the desktop client is now available in the web client, enabling users to perform temporal data analysis directly in their browser. This feature begins to close a key capability gap between the web and desktop clients.
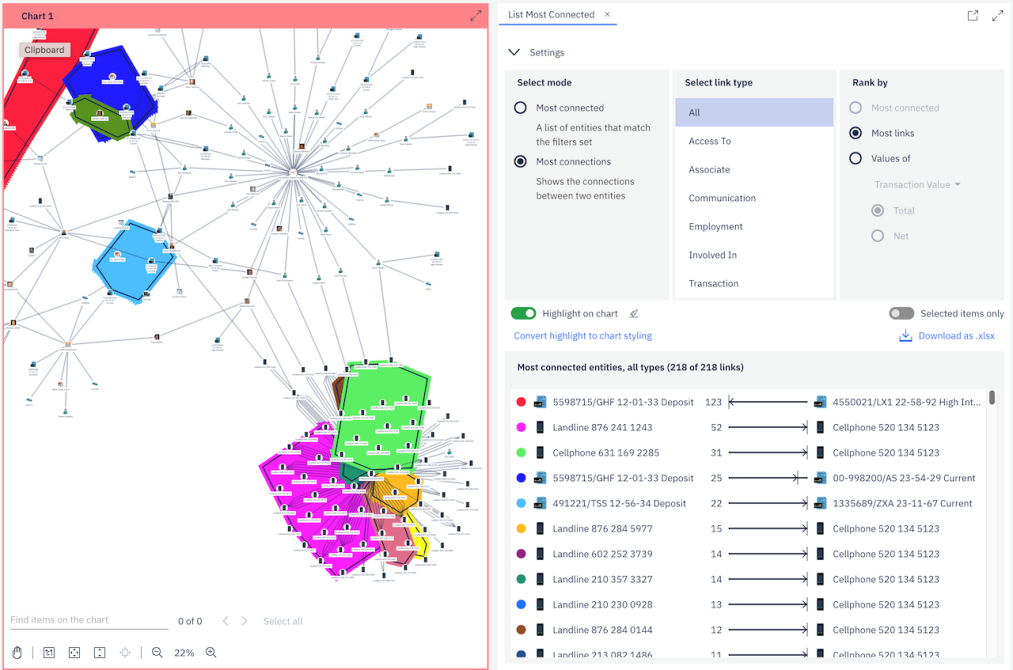
List Most Connected
- The “List Most Connected” tool from the desktop client is now available in the web client. Investigators and analysts can quickly identify the most connected entities in their chart, helping them surface central hubs in a network and prioritize which entities warrant further investigation. Results can be scoped to the entire chart or to the current selection. Results can be highlighted on the chart to show the corresponding entity in context.
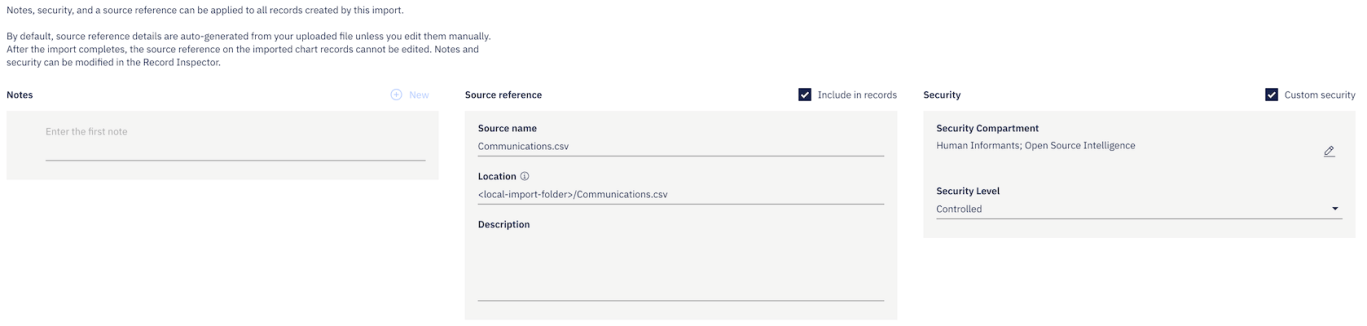
Importer security
- Users can now set security dimension values when importing data through the web importer. This removes the previous restriction of records being imported with only the default security and supports deployments where deliberate, per-import security settings are required.